We surveyed over 1000 consumers to find the tech, other than smartphones,...
Read More
Our second annual Mobile First survey of over 1000 connected consumers reveals...
Read More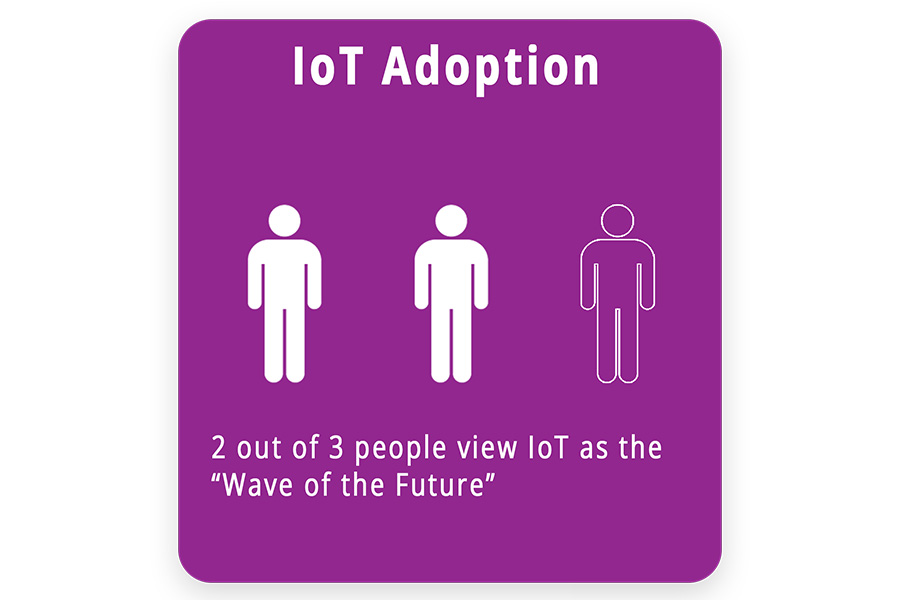
Metova repeated a 2018 survey of over 1000 consumers on their sentiment...
Read More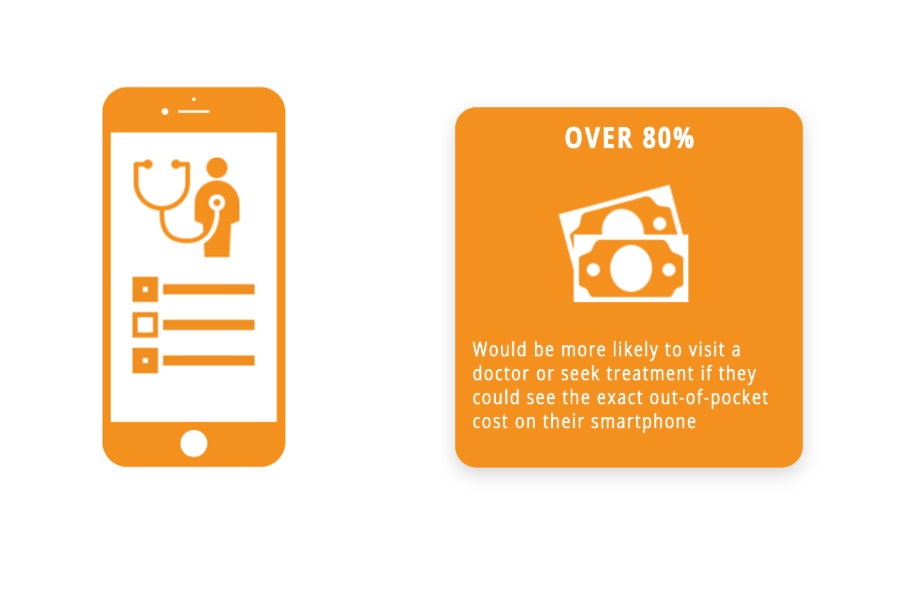
In Addition, Almost Three-Quarters Are Interested In Viewing And Managing Health Care...
Read More
Metova surveyed over 1000 people who have healthcare to gauge their understanding...
Read More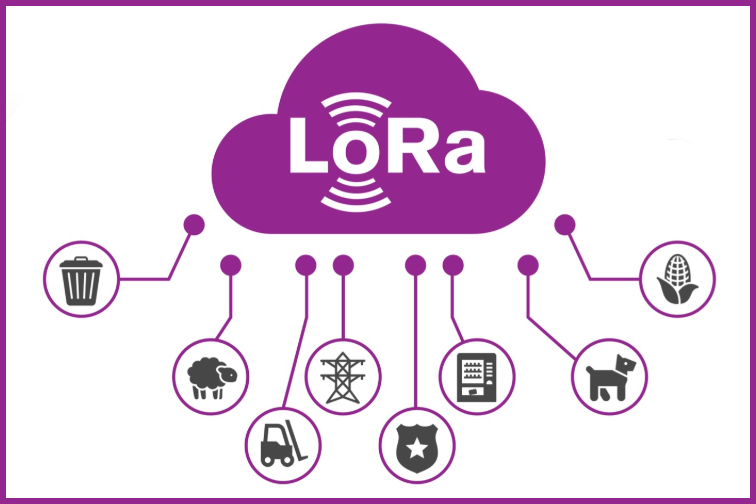
Is LoRa WAN the perfect solution to solving your wireless connection challenges?...
Read More
Metova commissioned a survey of over 1000 consumers to better understand their...
Read More
Only 20% of Consumers Understand the Term ‘Internet of Things’ Yet Nearly...
Read More
At Metova we specialize in helping customers leverage the latest technology to...
Read More

