Update: Mobile Voting, Blockchain and Biometrics
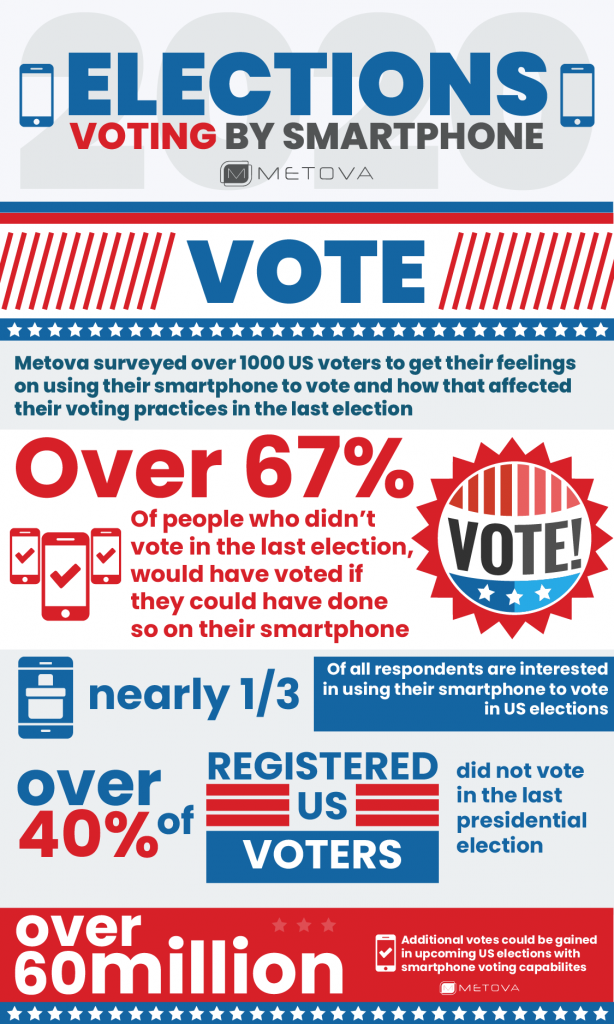
When we surveyed 1,000 US voters to get their feelings on using...
Read MoreInfographic: Insights on Working From Home During COVID-19
When it became clear that COVID-19 was bringing about a swift change...
Read MoreInfographic: Survey Reveals Tech-supported ‘New Normal’ For Hotels Amid COVID-19
Metova surveyed over 1000 people in the United States who have stayed...
Read MoreInfographic: Election Tech and Mobile Voting
Metova surveyed 1,000 US voters to get their feelings on using a...
Read MoreInfographic: Telemedicine - August 2020 Survey Reveals 81% Would Choose Telemedicine for Next Medical Appointment
Metova surveyed over 1000 people in the United States on Telemedicine –...
Read MoreInfographic: 2000+ Respondents on Contact Tracing and COVID-19
At the end of June 2020, we surveyed over 2000 people in...
Read MoreInfographic: Revealing Productivity Insights on Working From Home During COVID-19
Infographic for May 2020 survey revealing the sentiment of over 1000 employees...
Read MoreInfographic: 1000+ Respondents on Working from Home Due to COVID-19
We surveyed over 1000 consumers who are new to working from home...
Read MoreInfographic: 2010's Tech That Changed Our Lives
We surveyed over 1000 consumers to find the tech, other than smartphones,...
Read MoreInfographic: Trends in IoT - 2018 vs 2019 Consumer Survey Results
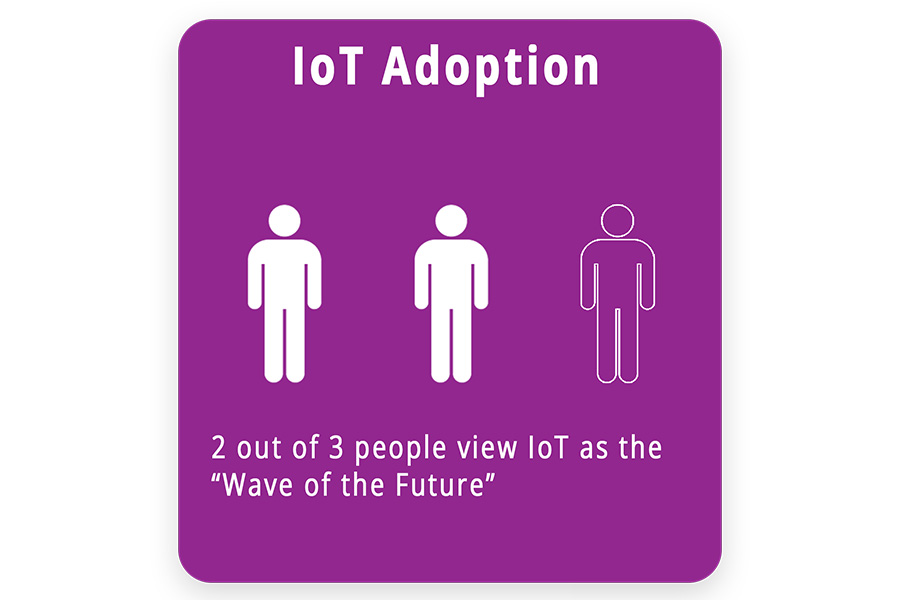
Metova repeated a 2018 survey of over 1000 consumers on their sentiment...
Read MoreNEWS: Survey: 80% of Consumers Would Be More Likely To Visit a Doctor or Seek Treatment if They Could See The Exact Out-of-pocket Cost On Their Smartphone
In Addition, Almost Three-Quarters Are Interested In Viewing And Managing Health Care...
Read MoreInfographic: Healthcare and Technology
Metova surveyed over 1000 people who have healthcare to gauge their understanding...
Read More